
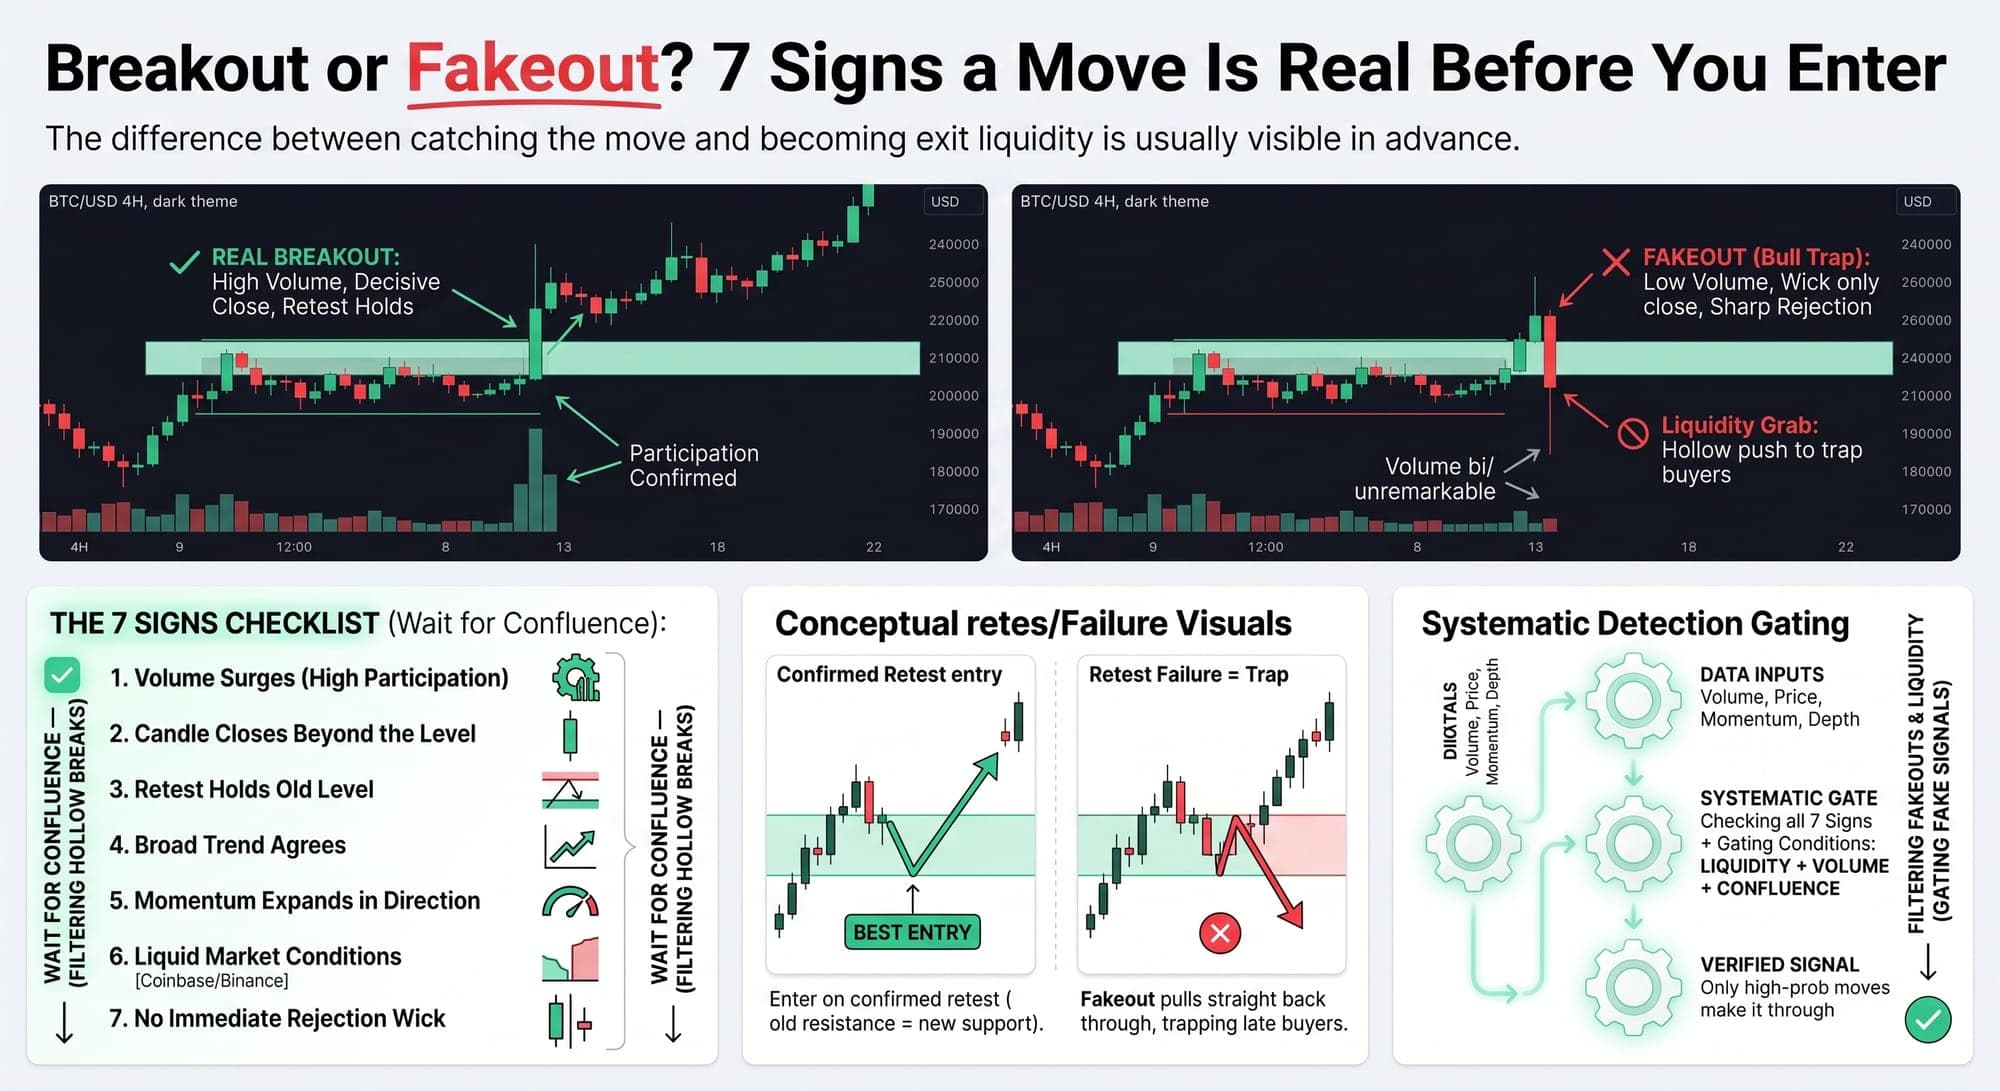
The difference between catching the move and becoming exit liquidity is usually visible in advance.
Few things in trading are more painful than a fakeout. Price breaks above a resistance level you've been watching, you buy the breakout, and within a few candles it reverses hard, slicing back below the level and stopping you out — right before it actually runs the way you expected. You were correct about the direction and still lost money.
Fakeouts (or "false breakouts") are among the most common ways traders get trapped, and in crypto they're especially rampant because of thin liquidity and deliberate stop-hunting. The good news: real breakouts and fakeouts usually look different before the reversal, if you know what to check. Here are seven signs that separate the real move from the trap.
First, why fakeouts happen
Understanding the mechanism makes the signs obvious. Key levels attract clusters of stop-loss orders — longs place stops just below support, shorts place stops just above resistance. Those clustered stops are a pool of liquidity. Large players sometimes push price just past a level specifically to trigger that pool, filling their own opposite orders against the cascade, then reversing. The "breakout" was never real participation — it was a liquidity grab.
So the core question behind every sign below is the same: is this move backed by genuine, broad participation, or is it a hollow push designed to trap?
Sign 1: Volume confirms the break
This is the single most important check. A real breakout is accompanied by a surge in volume — genuine participants stepping in and committing. A fakeout typically breaks the level on weak or average volume, because there's no real conviction behind it.
Before you trust any breakout, glance at the volume bar on the breakout candle. If it's dramatically larger than the recent average, that's a strong point in favor of real. If volume is unremarkable, be deeply suspicious — hollow breaks fail.
Sign 2: The candle closes beyond the level
A wick poking above resistance is not a breakout. Price briefly tagging a level and pulling back is exactly what a fakeout looks like. A real break shows price closing decisively beyond the level on your chosen timeframe — ideally with a strong-bodied candle, not a tiny indecisive one with long wicks.
Patience here saves accounts. Waiting for a candle close beyond the level, rather than reacting the instant price touches it, filters out a large share of fakeouts by itself.
Sign 3: The retest holds
The highest-probability breakout entries often aren't on the break at all — they're on the retest. After a genuine break, price frequently pulls back to the level it just broke (old resistance becoming new support) and bounces from it. That successful retest confirms the level has flipped and the breakout is real.
A fakeout, by contrast, doesn't hold the retest — it falls straight back through the level and keeps going. Entering on a confirmed retest instead of the initial break gives you both better confirmation and a tighter, clearer stop just beyond the flipped level.
Sign 4: The broader trend agrees
A breakout aligned with the higher-timeframe trend is far more likely to be real than one fighting it. A break above resistance during an established uptrend has the wind at its back. A break above resistance in the middle of a downtrend is more likely a countertrend fakeout — a bull trap.
Always zoom out. Ask whether the breakout is with the dominant trend or against it. With-trend breakouts deserve more trust; counter-trend ones deserve more skepticism.
Sign 5: Momentum supports the move
Check a momentum tool like RSI. In a genuine breakout, momentum is expanding in the breakout's direction. A warning sign is divergence — price breaking to a new high while momentum makes a lower high, indicating the move is running on fumes even as it breaks the level. Divergence at a breakout is a classic fakeout tell.
Sign 6: The move isn't happening in a liquidity vacuum
Fakeouts thrive in thin conditions — low-liquidity tokens, dead hours, holiday sessions. When the order book is thin, it takes very little to shove price past a level and trigger stops, which is precisely why manufactured fakeouts cluster in illiquid names and quiet times.
Prefer breakouts on liquid assets during active market hours, where a move past a level reflects real, broad participation rather than one actor pushing a thin book around. If a breakout on an obscure token during a dead session looks too clean, it probably is.
Sign 7: No immediate rejection wick
Watch the price action immediately after the break. A real breakout tends to hold above the level and build, or pull back gently for a retest. A fakeout often shows an immediate, sharp rejection — a long wick forming as price is violently pushed back below the level within a candle or two. That aggressive rejection is the trap springing shut. If you see it, the "breakout" has already told you it was fake.
Putting the seven together
No single sign is definitive. The power is in the confluence. A breakout that (1) surges on volume, (2) closes strongly beyond the level, (3) holds a retest, (4) aligns with the higher-timeframe trend, (5) has supportive momentum, (6) occurs in liquid conditions, and (7) shows no immediate rejection is a genuinely high-probability move. One that checks only one or two of these boxes is a coin flip at best.
The disciplined approach is to build a quick mental checklist and refuse to enter until enough of it is satisfied. Yes, this means you'll sometimes miss the very first candle of a move by waiting for confirmation. That's a feature, not a bug — the price of avoiding the majority of fakeouts is occasionally entering a bit later on the real ones. That's a trade worth making every time.
How systematic detection handles fakeouts
This is precisely the kind of problem automated market-intelligence excels at. A system watching the full market can evaluate all seven of these conditions instantly and consistently — checking whether volume genuinely surged, whether the move is happening in thin or liquid conditions, whether momentum confirms, whether the broader structure agrees — and refuse to flag a "breakout" that's really a liquidity grab. It's the same checklist a disciplined human runs, applied without emotion or FOMO to hundreds of tokens at once. The manufactured fakeout is designed to trigger naive detectors; beating it means looking past the price to the participation behind it.
The takeaway
Breakouts and fakeouts can look identical in the first instant — and completely different if you know the seven signs to check. Volume, a decisive close, a held retest, trend alignment, supportive momentum, liquid conditions, and the absence of an immediate rejection wick. Wait for confluence, favor the retest over the initial break, and accept that missing the first candle is a fair price for avoiding most traps.
The trader who chases every break becomes exit liquidity. The trader who checks the seven signs catches the moves that actually run.
PyreFi's engine evaluates breakout conditions — volume confirmation, liquidity, momentum, and structure — across the whole market at once, filtering out the hollow moves that trap manual breakout traders.