
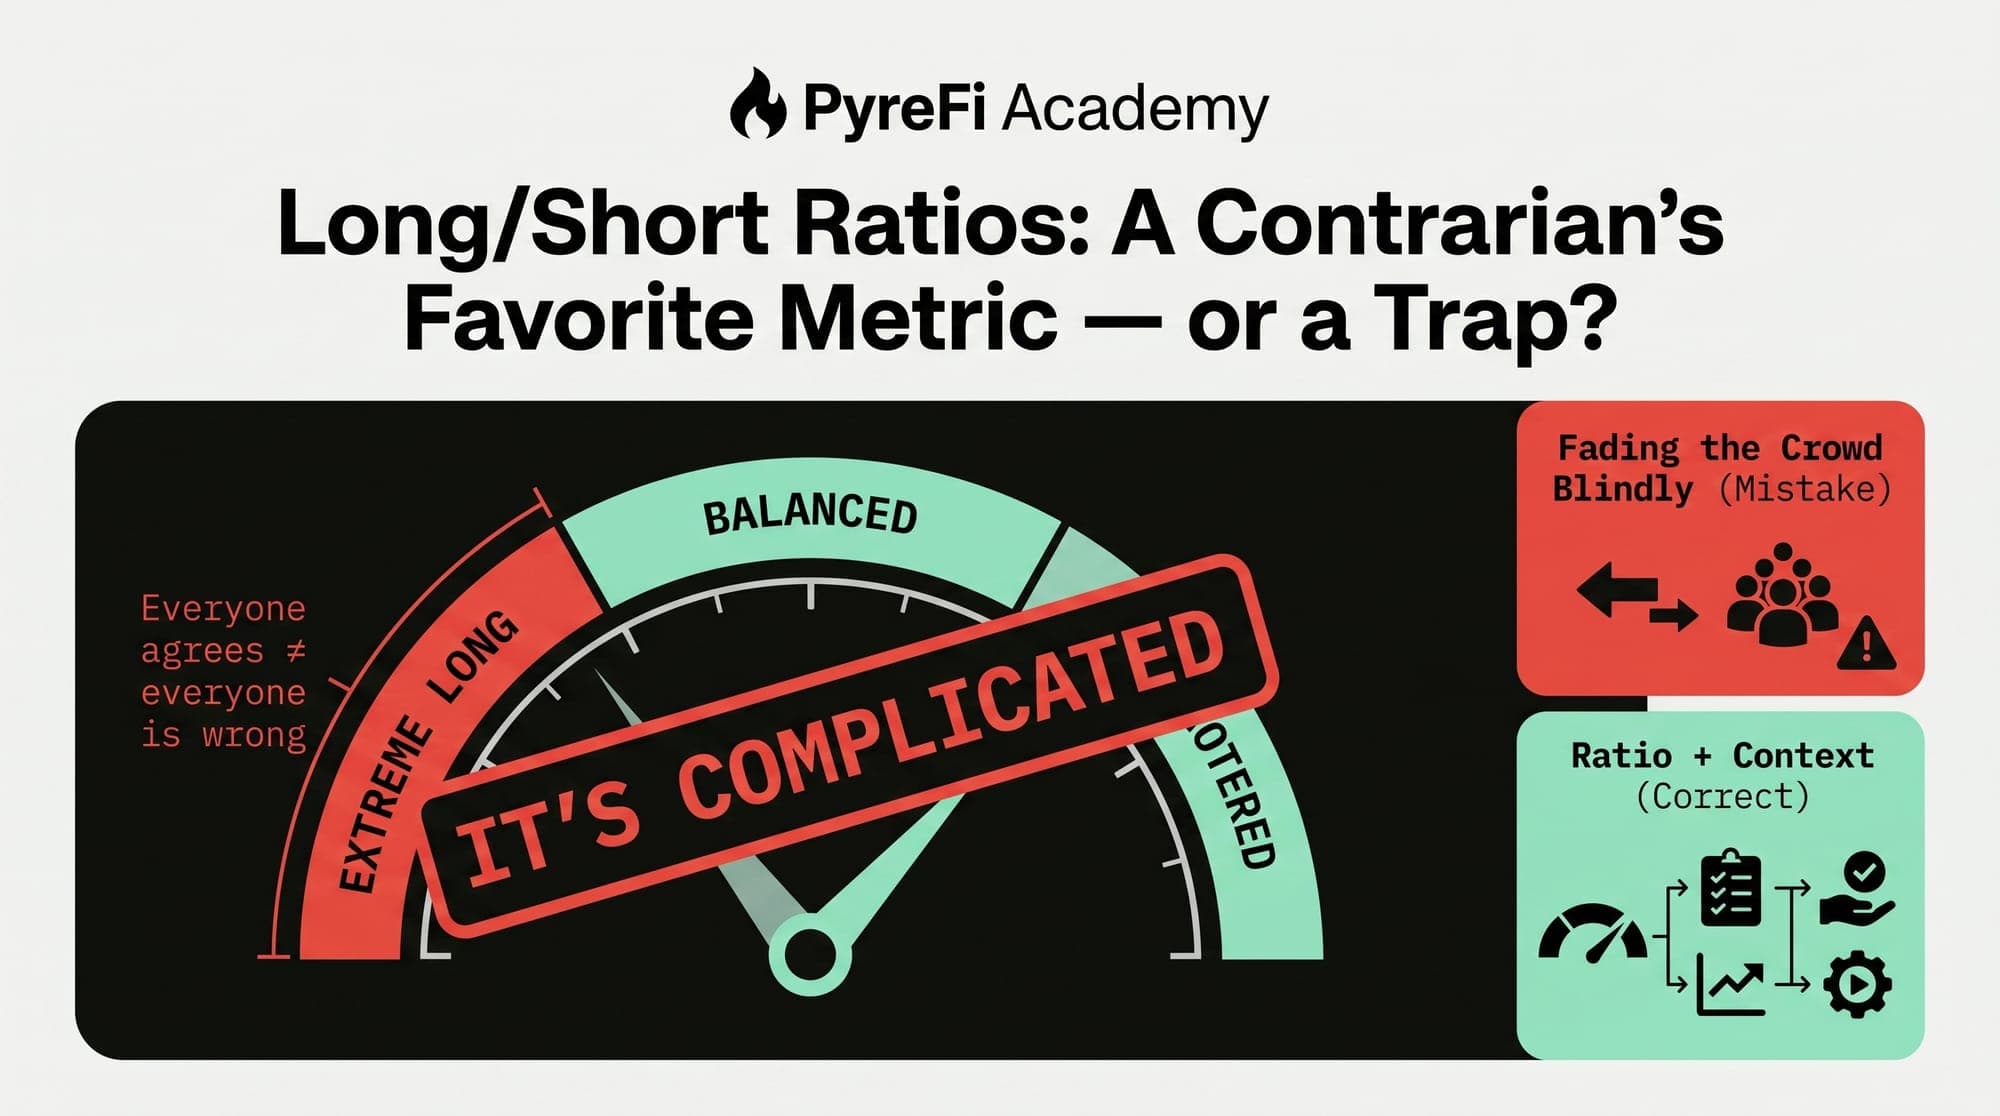
Everyone wants to fade the crowd. The long/short ratio makes it look easy. Here's why it usually isn't.
"Be greedy when others are fearful." It's the most quoted contrarian wisdom in markets, and crypto gives you a metric that seems to operationalize it perfectly: the long/short ratio. It appears to show you exactly what the crowd is doing so you can do the opposite. Fade the crowd, print money. Simple.
Except it's not simple, and traders who use the long/short ratio naively get trapped constantly. This metric is genuinely useful and genuinely misleading, depending entirely on how you read it. Let's separate the signal from the trap.
What the long/short ratio measures
The long/short ratio compares the number of traders (or the volume of positions) that are long versus short on an asset. A ratio of 2.0 means twice as many longs as shorts; a ratio of 0.5 means twice as many shorts as longs. It's presented as a direct readout of crowd positioning.
The contrarian logic is appealing: if the crowd is overwhelmingly long, and the crowd is usually wrong at extremes, then heavy long positioning should precede a drop (and heavy short positioning a rally). Fade the majority.
There's real truth in this — but there are several traps buried in it that make naive contrarianism dangerous.
Trap 1: which long/short ratio?
The first problem is that there's no single "the" long/short ratio. Different data sources measure completely different things:
- Accounts ratio: the percentage of trader accounts long vs. short. This treats a whale and a $50 account equally.
- Positions ratio: the ratio weighted by position size. This reflects where the money is, not where the account count is.
- Top traders ratio: positioning of the largest or most successful accounts specifically.
These can tell opposite stories. The account ratio might show retail heavily long (many small long accounts) while the position ratio shows big money net short (fewer, larger short positions). If you're fading "the crowd," which crowd? The naive trader sees one ratio, assumes it's definitive, and fades the wrong group.
Trap 2: the crowd isn't always wrong
The core contrarian assumption — the crowd is wrong at extremes — is only sometimes true. In a strong trend, the crowd is often right for a long time. During a powerful bull run, the crowd is heavily long... and price keeps rising, rewarding them. Fading a heavily-long ratio in the middle of a strong uptrend is a great way to get run over repeatedly.
The contrarian edge exists at genuine extremes and turning points, not simply whenever the ratio leans one way. Heavy long positioning in a mature, exhausted, over-funded uptrend is meaningfully different from heavy long positioning at the start of a fresh trend — even if the ratio reads the same. The number without context is nearly useless.
Trap 3: positioning can be hedged or nuanced
A "short" position in the data isn't always a bearish bet. Traders short perps to hedge spot holdings, to run market-neutral basis trades, or as one leg of a complex position. So a high short ratio doesn't cleanly mean "the crowd is bearish and will be squeezed." Some of that shorting is hedging that carries no directional conviction at all. The ratio flattens all of this nuance into one number, losing the why behind the positioning.
Trap 4: retail-heavy exchanges vs. pro-heavy exchanges
The long/short ratio on a retail-dominated exchange reflects retail sentiment; on a pro-heavy venue it reflects something else. Fading "the crowd" only makes sense if you're actually looking at the crowd that tends to be wrong. Mixing sources, or assuming all venues represent the same population, leads to muddled conclusions.
So how do you actually use it?
Despite all these traps, the long/short ratio has real value — when used carefully and in context.
1. Read it at extremes, not in the middle. The ratio is most meaningful when it reaches unusually lopsided levels for that asset. A moderate lean tells you little. An extreme lean flags that positioning is crowded and potentially fragile — a warning, not a trigger.
2. Combine it with funding and open interest. This is the key. The long/short ratio alone is weak, but together with extreme funding (the crowd is paying to hold this position) and high open interest (lots of leverage loaded), it paints a coherent picture of crowded, fragile positioning ripe for a squeeze. The three derivatives metrics corroborate each other. Any one alone is a guess; all three aligned is real signal.
3. Distinguish the account ratio from the position ratio. Watch for divergences — retail heavily long while big money leans short is often a more meaningful signal than either alone. When small accounts and large accounts disagree, the large accounts are usually the ones to respect.
4. Never fade a strong trend on the ratio alone. Wait for price to confirm exhaustion — a break of structure, a rejection at a key level — before acting on the contrarian read. The ratio tells you the market is stretched; price tells you when it's actually turning.
5. Treat it as context, not a signal. Like funding, the long/short ratio is best used to understand the positioning backdrop of a trade, not as a standalone entry trigger.
The honest verdict
The long/short ratio is neither a magic contrarian button nor useless noise — it's a context tool that's dangerous in isolation and valuable in combination. The traders who treat it as "crowd is long, so I short" get trapped by trends, hedged positioning, ambiguous data sources, and the simple fact that crowded can get more crowded. The traders who use it as one corroborating input alongside funding, open interest, and price action extract genuine insight about positioning fragility.
Why context-aware reading matters
This is a recurring theme in derivatives analysis: no single metric is a signal by itself. Positioning data like the long/short ratio only becomes reliable when read relative to an asset's own history and in combination with other derivatives data. This is precisely how systematic market-intelligence approaches treat it — not as a raw contrarian trigger, but as one thread in a fabric of positioning context (funding, OI, liquidations, order flow) woven together. The lesson for a human trader is the same: the long/short ratio is a supporting actor, never the star.
The takeaway
The long/short ratio looks like a shortcut to contrarian riches, and that's exactly why it's a trap for the naive. It's ambiguous (which ratio? which venue? hedged or directional?), and the crowd it shows is often right during trends. Its real value emerges only at extremes and only in combination with funding and open interest, where the three metrics together reveal genuinely crowded, fragile positioning — confirmed by price before you act.
Fade the crowd, sure. But make absolutely sure you know which crowd you're looking at, whether they're actually stretched, and whether price agrees — before you bet against them.
PyreFi reads positioning metrics like the long/short ratio relative to each asset's history and in combination with funding, open interest, and order flow — context that turns an ambiguous number into usable signal.