
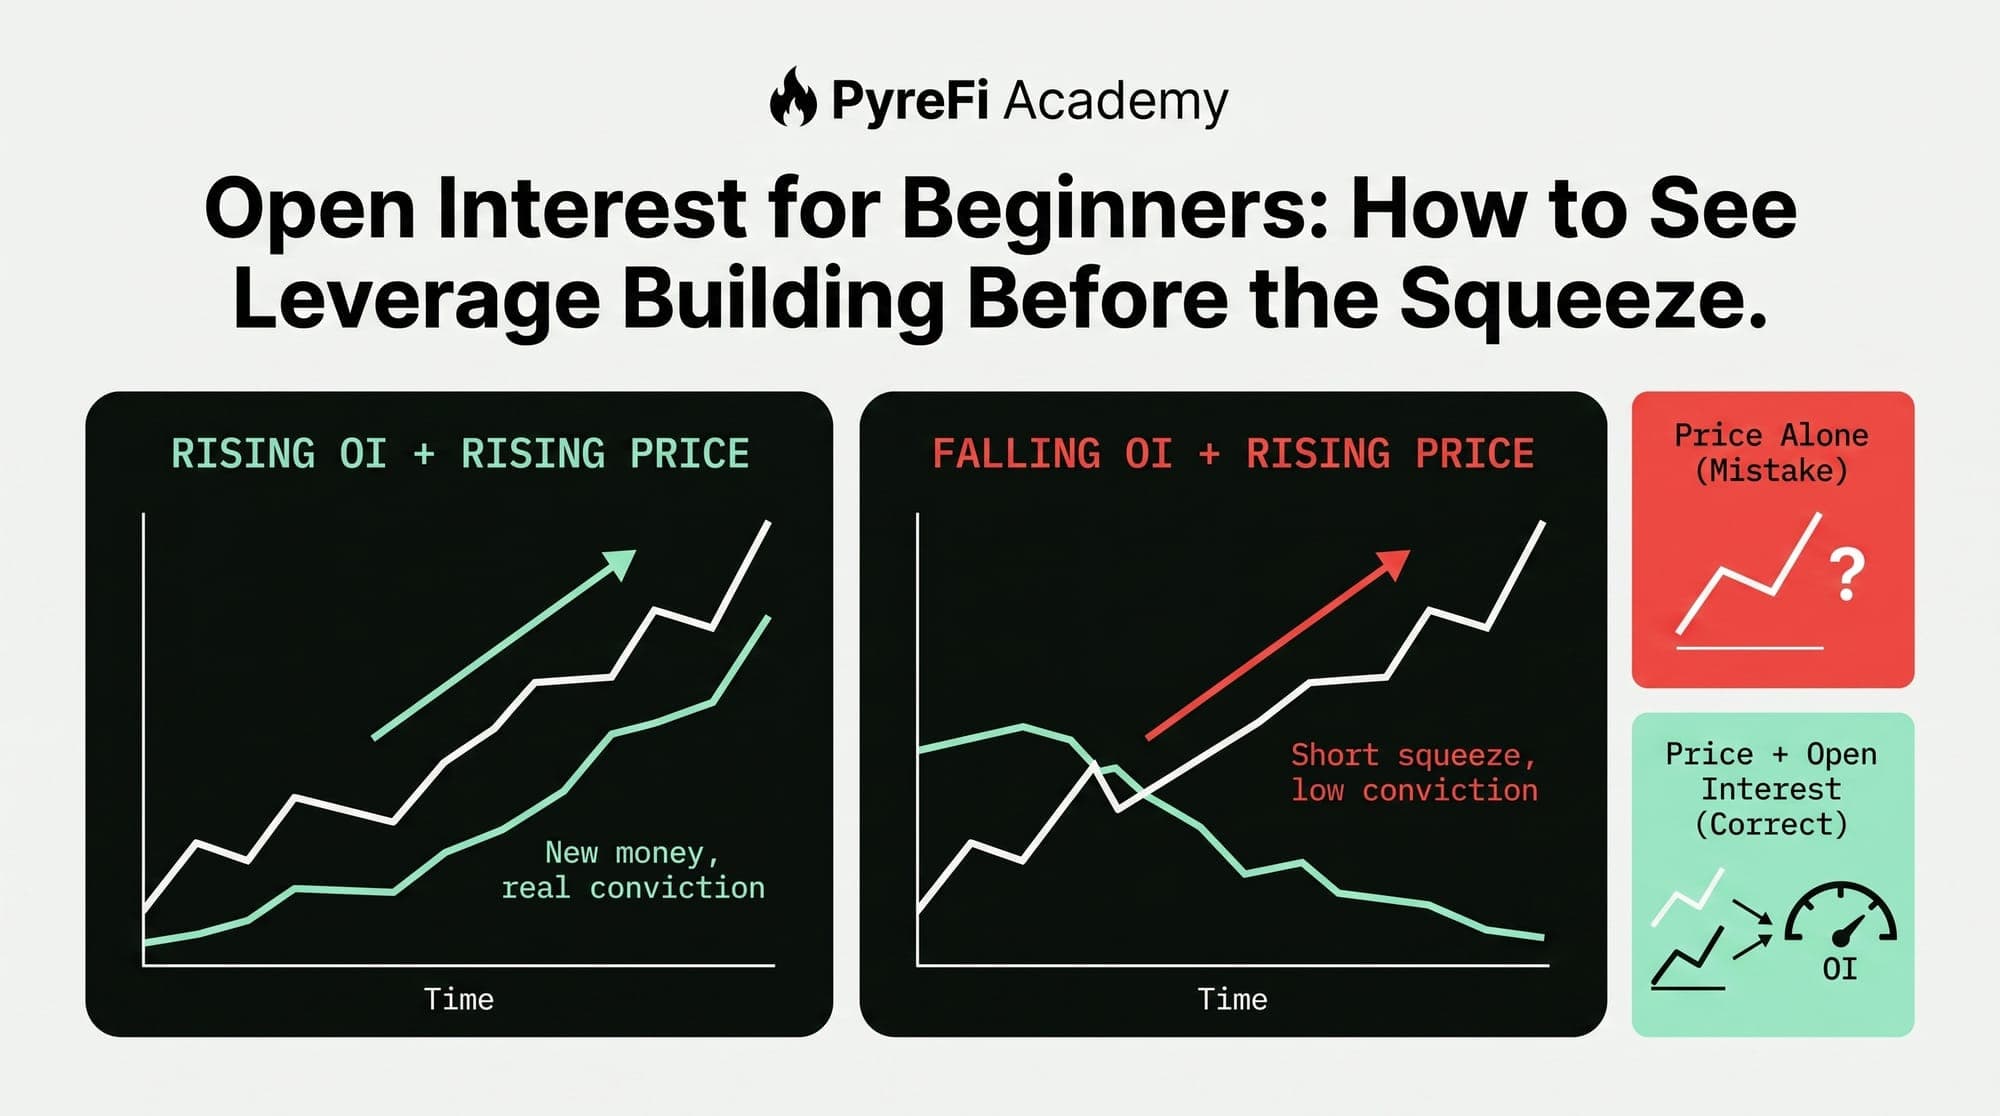
The metric that shows you how much fuel is loaded into the market — and whether a move has conviction or is running on empty.
If funding rates tell you which way the crowd is leaning, open interest tells you how much they've committed. It's one of the most powerful derivatives metrics available to crypto traders, and it answers a question price alone can't: is this move backed by real, building conviction, or is it running on fumes?
Learn to read open interest and you can literally watch leverage accumulate in the market before it unwinds in a squeeze. Here's how it works, from the ground up.
What open interest actually is
Open interest (OI) is the total number of outstanding derivative contracts (like perpetual futures) that haven't been closed. It represents the total amount of leveraged positions currently open in the market.
A crucial distinction from volume: volume counts how many contracts traded in a period; open interest counts how many contracts are currently open. Volume is a flow (activity over time); open interest is a stock (positions held right now).
Here's the mechanic that trips up beginners: open interest only rises when new contracts are created, which requires a new buyer and a new seller both opening fresh positions. It falls when positions are closed. So:
- OI rises → new money entering, new positions being opened. Leverage is building.
- OI falls → positions being closed, money leaving. Leverage is unwinding.
That single fact — rising OI means new leverage, falling OI means leverage exiting — is the foundation of everything OI can tell you.
Reading OI alongside price: the four scenarios
The magic happens when you combine the direction of price with the direction of open interest. There are four combinations, and each tells a distinct story.
1. Price up + OI up → strong bullish conviction. New money is flooding in on the long side, opening fresh positions and driving price higher. This is a healthy, well-supported uptrend — the move has real fuel behind it. Continuation is more likely.
2. Price up + OI down → weak rally (short covering). Price is rising, but open interest is falling — positions are being closed, not opened. This often means the rally is driven by shorts covering (buying back to close their losing positions) rather than new bulls entering. It's a rally running on the exit of bears, not the conviction of bulls. These rallies tend to fizzle once the shorts are done covering.
3. Price down + OI up → strong bearish conviction. New money entering on the short side, driving price down with fresh positions. A well-supported downtrend with real selling conviction. More downside likely.
4. Price down + OI down → weak decline (long capitulation). Price falling as positions close — often longs capitulating and exiting rather than new shorts committing. The decline is driven by bulls giving up, not bears attacking. These can mark exhaustion points where selling is drying up.
This four-way read transforms open interest into a lie detector for price moves, exactly the way volume does — but for leverage specifically. A breakout on rising OI has conviction; a breakout on falling OI is suspect.
Watching the squeeze build
Here's where OI becomes genuinely predictive. When open interest climbs to unusually high levels, it means a large amount of leverage has accumulated in the market. That's a loaded spring.
High and rising OI, especially combined with extreme funding, is a classic pre-squeeze setup. All that leveraged positioning is vulnerable: if the market moves against the crowded side, those positions get liquidated, and the liquidations cascade. The more OI that built up, the more violent the potential unwind.
So a trader watching OI can see the danger accumulating before it releases: - OI grinding higher and higher during a rally = more and more leveraged longs piling in = growing squeeze risk to the downside. - A sudden sharp drop in OI = a mass liquidation or position-closing event just occurred — often coinciding with a violent price move as the leverage flushed out.
That sharp OI drop is the signature of a squeeze happening in real time. Seeing OI collapse alongside a price spike tells you leverage just got wiped, which often (though not always) marks a local exhaustion point.
Practical ways to use open interest
1. Confirm the conviction behind moves. Before trusting a breakout or trend, check whether OI supports it. Rising OI in the trend's direction = conviction. Falling OI = a move running on covering or capitulation, likely to fade.
2. Gauge squeeze risk. Unusually high OI = lots of leverage loaded = elevated risk of a violent unwind. Combine with funding for a fuller picture: high OI + extreme funding = maximum fragility.
3. Spot exhaustion. A sharp OI drop during a big move signals a leverage flush — often a capitulation or squeeze climax that can mark a turning point.
4. Distinguish real trends from short-lived spikes. A price move backed by growing OI is structurally different from one on shrinking OI, even if the candles look identical.
Common mistakes
Confusing OI with volume. They're different. High volume with flat OI means lots of contracts changed hands but net positions didn't grow (traders passing positions among themselves). High volume with rising OI means genuine new positioning. Always read them together.
Reading OI without price context. Rising OI is neither bullish nor bearish on its own — it depends entirely on which direction price is moving. Always use the four-scenario framework.
Treating high OI as an automatic reversal. High OI signals risk of a squeeze, not a guaranteed one. Crowded markets can get more crowded. Use it to calibrate caution, confirmed by price action, not as a standalone trigger.
Why derivatives data is an edge
Most retail traders watch only the spot price chart and never look at open interest. That's a real blind spot, because OI often reveals the character of a move — conviction versus covering, accumulation versus capitulation — that price alone hides. This is why serious market-intelligence systems ingest derivatives data like OI across the entire market, using it to judge whether moves have genuine leverage behind them and where dangerous positioning is building. A system that sees OI building to extremes across many tokens can flag squeeze risk that a price-only view would completely miss.
The takeaway
Open interest measures the total leverage currently loaded into the market. Rising OI means new positions and building conviction; falling OI means positions unwinding. Read it against price — the four scenarios tell you whether a move has real fuel or is running on covering and capitulation. And watch the extremes: high, rising OI is a loaded spring, and a sharp OI drop is that spring releasing in a squeeze.
Add open interest to your derivatives toolkit alongside funding rates, and you'll start seeing the market's leverage accumulate and unwind in real time — the mechanics beneath the price that most traders never even look at.
PyreFi ingests open interest across the full market, using it to judge conviction behind moves and to flag where leverage is building toward a squeeze — context a spot-only view can't provide.