
The timeframe you trade shapes everything — and most traders never consciously choose theirs.
Two traders look at the same asset at the same moment and reach opposite conclusions. One is certain it's a screaming buy. The other is convinced it's rolling over. Neither is wrong — they're just looking at different timeframes. And that single, often-unconscious choice may be the biggest hidden variable in your trading results.
Most traders drift into a default timeframe — often the 4-hour, because it feels like a reasonable middle ground — without ever asking whether it fits their strategy, their schedule, or their temperament. That unexamined default can quietly sabotage every trade you take. Let's fix it.
What a timeframe actually is
A timeframe is simply how much time each candle represents. On a 1-hour chart, every candle is one hour of price action. On a daily, each candle is a full day. Same asset, same price history — but the resolution changes completely.
This isn't a cosmetic setting. It fundamentally changes what you see:
- Higher timeframes (daily, weekly) compress lots of activity into each candle. They show the dominant trend and filter out short-term noise. Signals are fewer but more reliable.
- Lower timeframes (15-minute, 5-minute) explode each moment into detail. They show precise, fast-moving action — and a huge amount of noise. Signals are frequent but far less reliable.
Neither is "better." They answer different questions.
The core problem: noise vs. signal
Here's the trade-off at the heart of timeframe selection. As you drop to lower timeframes, you gain precision but lose reliability. Every level looks significant on the 5-minute chart, but most of them are just noise — random wiggles that mean nothing on any larger scale.
On the 5-minute, price is constantly "breaking support" and "reclaiming resistance," triggering emotional reactions and impulsive trades. The same period on the daily chart is a single, calm candle. The lower-timeframe trader took ten trades and got whipsawed; the daily trader saw one candle and did nothing. Often the daily trader was right.
This is why the lower-timeframe trap is so dangerous, especially for beginners and emotional traders: it manufactures false urgency. It shows you dozens of "signals" a day, most of them noise, and dares you to act on all of them. Overtrading, whipsaws, and death-by-a-thousand-fees usually trace back to trading too low a timeframe.
Why the 4-hour can sabotage you specifically
The 4-hour chart has a seductive reputation as the "sweet spot" — detailed enough to feel active, broad enough to seem meaningful. And for some swing traders, it genuinely is a great primary timeframe.
But it becomes a saboteur in two common ways:
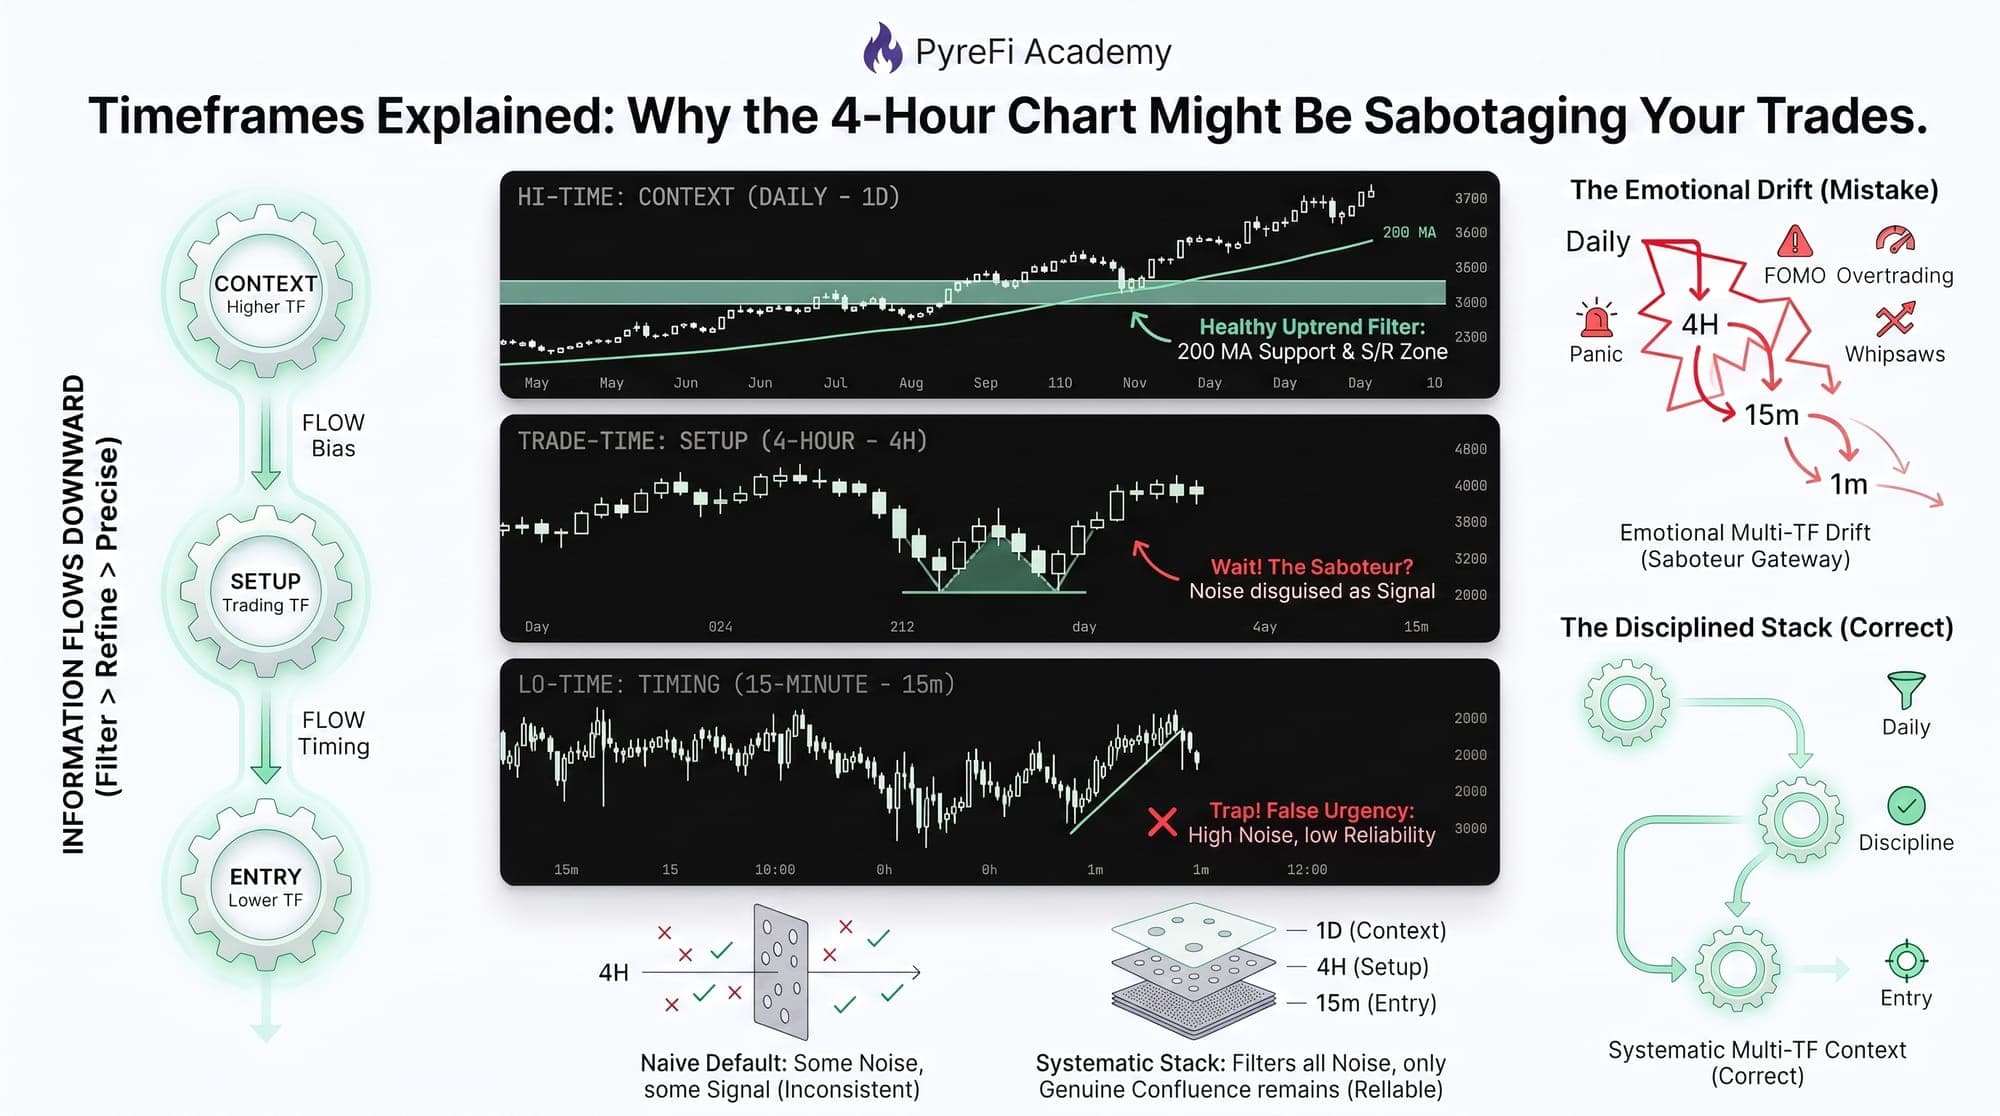
1. It's low enough to fool you into noise, but high enough to feel authoritative. A false breakout on the 4-hour looks a lot more convincing than one on the 5-minute. Traders trust it, size up on it, and get trapped — because from the daily's perspective, that "4-hour breakout" was just an intraday wick.
2. It encourages timeframe drift. A trader plans a swing trade on the daily, then "manages" it on the 4-hour, then watches the 1-hour, then panics on the 15-minute and closes a perfectly good trade at the worst moment. The 4-hour is often the gateway to this downward spiral of ever-lower timeframes and ever-worse decisions.
The 4-hour isn't inherently bad. It's bad when it's your unexamined default and you let it override the higher-timeframe context that should govern the trade.
The solution: multi-timeframe analysis
Professionals don't pick one timeframe — they use a stack of them, each with a defined job. A common and effective structure uses three:
- The higher timeframe (context): Zoom out to establish the dominant trend and the major support/resistance zones. If you're swing trading, this might be the daily or weekly. This timeframe answers "which direction should I be biased?" You only take trades aligned with it.
- The trading timeframe (setup): One step down, where you actually identify your setup and make decisions. For a daily-context swing trader, this might be the 4-hour. This answers "is a valid setup forming here, in line with my higher-timeframe bias?"
- The lower timeframe (timing): One more step down, used only to fine-tune your exact entry once the setup is confirmed. This answers "what's the best price to get in right now?" — not "should I trade?"
The critical rule: information flows downward. The higher timeframe rules. You never let a lower-timeframe wiggle talk you out of a trade the higher timeframe supports, and you never take a lower-timeframe "signal" that contradicts your higher-timeframe bias. The 4-hour's job is to serve the daily, not to override it.
Matching timeframe to your life
There's also a deeply practical dimension: your timeframe must fit your schedule and temperament.
- If you have a full-time job and can only check charts a few times a day, trading the 5-minute is a recipe for disaster — you'll miss moves and make rushed decisions. The daily or weekly, with swing or position trades, fits your life.
- If you're glued to screens all day and thrive on fast decisions, lower timeframes may suit you — but only if you have the discipline to survive the noise.
- If you're emotional or new, higher timeframes are almost always the right call. They force patience, reduce the number of decisions, and give each one more weight.
A timeframe you can't actually monitor properly will sabotage you no matter how good your analysis is. Honesty about your own life is part of the choice.
How systematic approaches handle this
One reason automated market-intelligence systems can be steadier than discretionary traders is that they don't suffer from emotional timeframe drift. They evaluate each timeframe's role deliberately and consistently — using higher-timeframe context to filter, and lower-timeframe data only for precision — rather than panic-dropping to the 1-minute chart in a moment of fear. The lesson for a human trader is to impose that same discipline on yourself: define each timeframe's job in advance, and don't let emotion move you down the stack.
The takeaway
Your timeframe isn't a trivial setting — it's one of the most consequential choices you make, and most traders never make it consciously. Lower timeframes offer precision at the cost of reliability and manufacture false urgency. Higher timeframes offer reliability and force patience. The 4-hour chart sabotages traders not because it's flawed, but because it's so often an unexamined default that overrides the context that should govern the trade.
Use a stack: higher timeframe for context and bias, a trading timeframe for setups, a lower one only for timing — with information always flowing downward. Match it to your actual life. And never let a small candle on a small timeframe overrule the big picture. Choose your timeframe on purpose, and half your "strategy problems" will quietly disappear.
PyreFi applies multi-timeframe context consistently across the market — higher timeframes to filter, lower-timeframe data only to refine — without the emotional drift that trips up discretionary traders.